%DiffHIGH

Info:

The percentage difference between the in running HIGH price and the Betfair starting price. This can be altered in the preferences to be based on prices with the stake added or without the stake added. The default is with the stake added.

%DiffLOW

Info:

The percentage difference between the in running LOW price and the Betfair starting price. This can be altered in the preferences to be based on prices with the stake added or without the stake added. The default is with the stake added.

Back to Lay Reports

Info:

The in-running (IR) module in Proform is a significant aid to anyone who has an interest in how a race develops IR or wants to see how a horse trades during their performances.

Using our horse racing software you research back to lays, lay to back scenarios and determine which horses will break slowly thus likely to trade higher in running at the beginning of a race.

The In Running Tab in System Builder contains various fields, which can be used to analyse In Running Prices.

Platinum members were able to take advantage of our automated in running reports on our web site however you can generate your own Back to Lay Reports (Flat/Jump) via the system builder.

To generate your own Back to Lay reports following these steps


1. Select todays date in the Date Tab and select “Use HORSE decs”


2. Choose a Course


3. Then in in running tab set % lower than Betfair SP to >=50 (or whatever percentage you require)


4. Then click on run Back 2 Lay Report (Flat) in this example you can add in a filter of number of runs using the box ( in this example 5)


5. The report will be generated similar to the one shown in the image below and you can see the equivalent report on the web site. The new report in the software adds the power rating rank if you have them imported into user rating 1 and also if you run it on a day where results are known you can see the actual percentage each horse went lower in running in the %DiffLOW column.

Colour Coding the Data using the In Running Tab in Preferences

Info:

The colour coding of the In Running Highs and Lows throughout Proform can be changed from within the Preferences tab

You can get to the preferences in three ways

  • From the buttons on the left sidebar
  • From the Options Menu at the top of Proform, then click Preferences
  • From the Preferences button at the top of the In Running Tab when viewing a race/result in data view.

Once you have the preferences open click on the In Running Tab and you will be presented with the following screen.

Here is an explanation of the various In Running Preferences

Hide 1.01 prices on winner

If you have this ticked then the In Running price of 1.01 will be replaced with a dash (-) wherever the In Running price is displayed.  i.e. The race results screen, In Running tab in data view, drill down in system builder etc

There are some instances where horses win and do not reach 1.01, these In Running prices will still be shown.

Hide 1000 prices on winner

If you have this ticked then the In Running price of 1000 will be replaced with a dash (-) wherever the In Running price is displayed.  i.e. The race results screen, In Running tab in data view, drill down in system builder etc. There are many instances when horses lose but do not reach 1000 In Running, these In Running prices will still be shown.

Note

  • Most horses do reach 1000 in running but on many occasions it is to extremely small volumes, remember the In Running prices in Proform are only reported when the volume bet is at least £2, i.e. £1 on the back side and £1 on the lay side)

In Running Lowest

If you have this ticked then the colours and percentage you set for the In Running Low prices will be used throughout Proform and wherever the In Running Low price is displayed.  i.e. The race results screen, In Running tab in data view, drill down in system builder etc.You can set the percentage lower than BSP to whatever you wish and by clicking the buttons at the side you can choose the background colour and font colour for the In Running Lows throughout Proform.  Your chosen colours are displayed around the percentage you enter in this screen so you can see how they will look.

In Running Highest

If you have this ticked then the colours and percentage you set for the In Running High prices will be used throughout Proform and wherever the In Running High price is displayed.  i.e. The race results screen, In Running tab in data view, drill down in system builder etc
You can set the percentage higher than BSP to whatever you wish and by clicking the buttons at the side you can choose the background colour and font colour for the In Running Highs throughout Proform.  Your chosen colours are displayed around the percentage you enter in this screen so you can see how they will look.

Once you have set your In Running Colour Preferences, click OK and they will be remembered until you change them again and even if you close Proform they will be remembered the next time you use Proform.

Note

  • If you have any In Running Prices on screen while changing the In Running Preferences, then after clicking OK they will not be reflected on screen until a refresh of the creen is done.)

Data Coverage and Scope of Data

Info:

The In Running Module in Proform covers data from 2008 to date.

The data covered is In Running Highs and Lows for each runner in each race and percentages lower and higher.


How do I research the lowest In Running prices?

Info:

Whilst the original ways of betting or investing still remain, once the tapes go up or the stalls open that won’t be the end of the way that you can manage your bet or even have a bet if you have not yet invested.

The in-running (IR) module in Proform is a significant aid to anyone who has an interest in how a race develops IR or wants to see how a horse trades during their performances.

Using our horse racing software you research back to lays, lay to back scenarios and determine which horses will break slowly thus likely to trade higher in running at the beginning of a race.

But say you wanted to research the returns if you laid the field at a particular In Running Low price, at a particular course, or distance etc.?

In the sections below we show how you can find the answer easily using one of the many features in the Proform IR module.


Researching Lowest In Running Prices

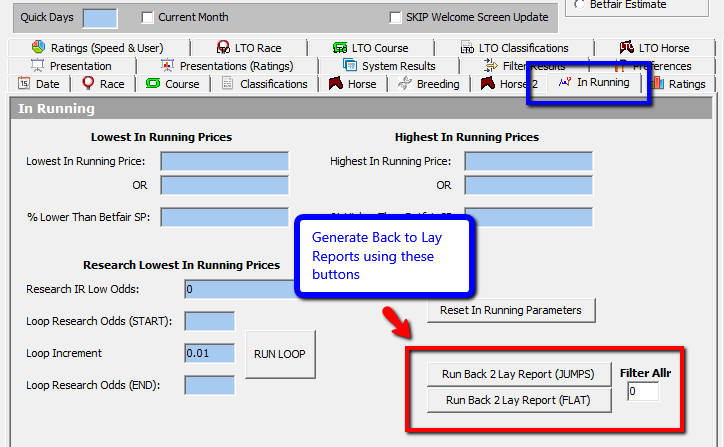
With the Proform software, the in running tools can found in our system builder IR tab as shown in the image below:

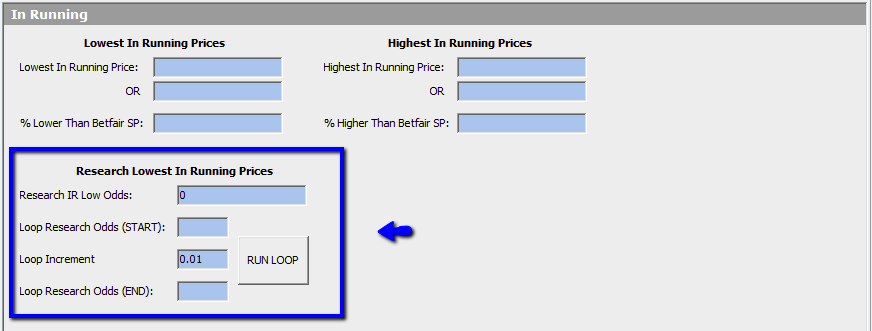
Under the heading Research Lowest In Running Prices we have four parameters and these are used to research what profit/loss laying horses at a particular In Running Low price would return.

To show you how to use this area for research let’s use and an example.


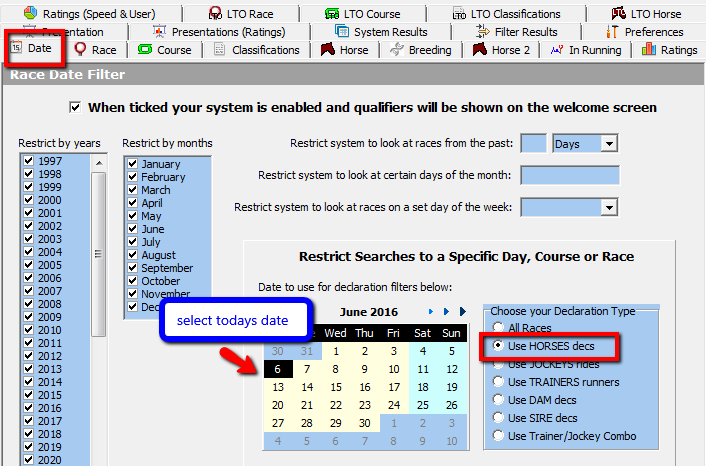
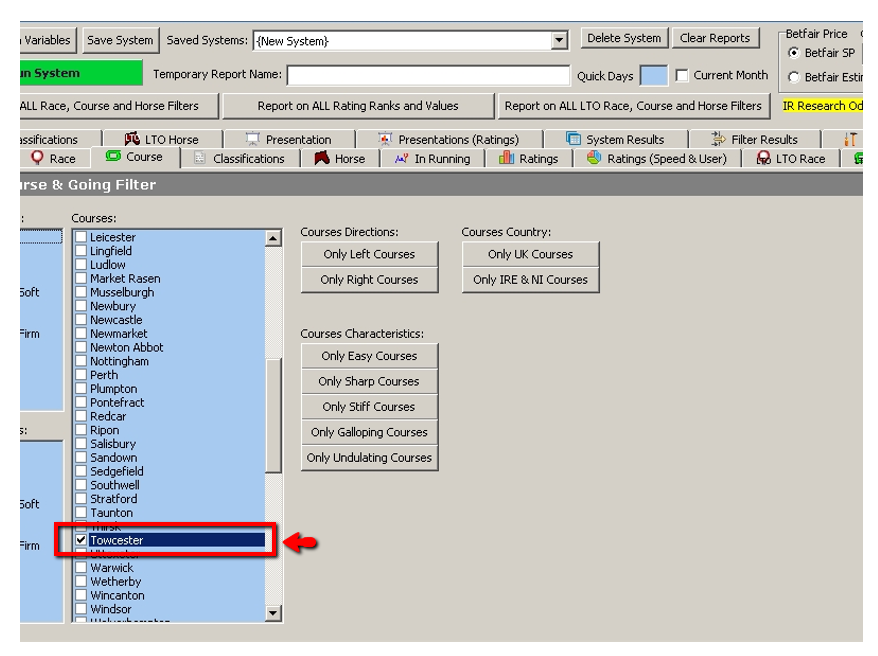
Researching Lowest In Running Prices at Towcester

We will look at Towcester Racecourse, mainly because the uphill finish can produce some unexpected results but you can conduct similar research at any race course in the UK or Ireland.

First of all let’s analyse all of the results at Towcester to simulate the scenario of laying every horse in every race at 1.38 In Running.

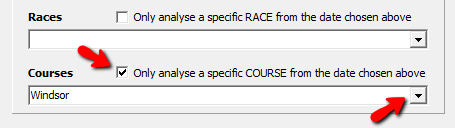
To do this we set the In Running Low Price to <=1.38 and the Research IR Low Odds to 1.38 and the course to Towcester in the Course Tab.


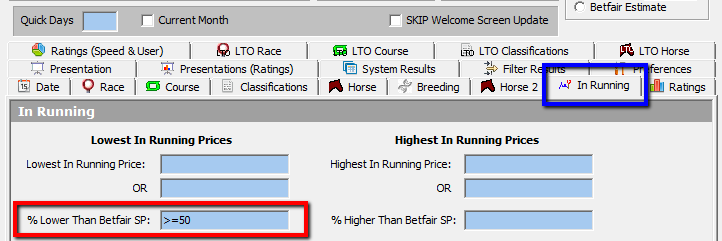
Below is the screen shot of the In Running Tab set-up and you can see that because we have used research odds this is highlighted in yellow under the Betfair Price box.

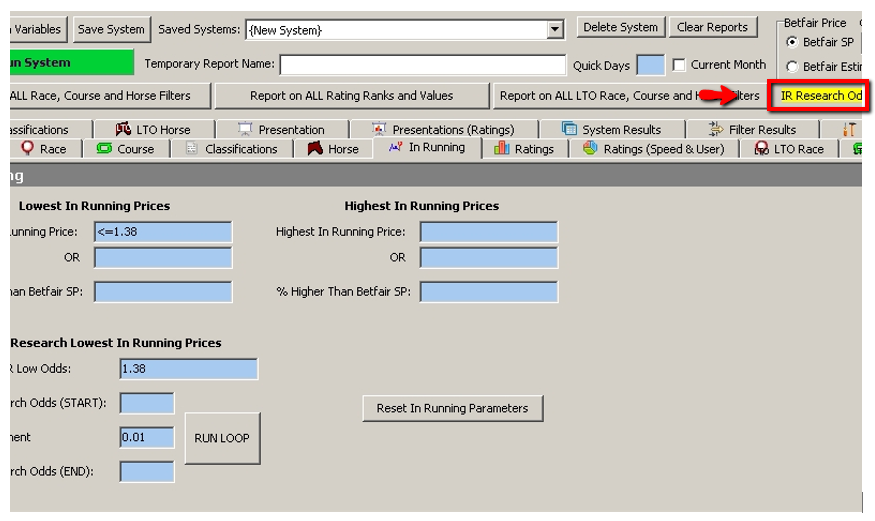
This is a reminder that you are using a research price for this system because the research price will override the Betfair price normally used.

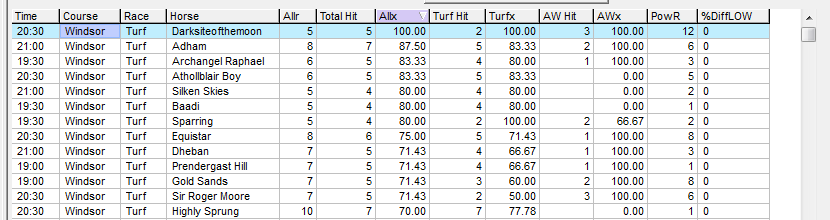
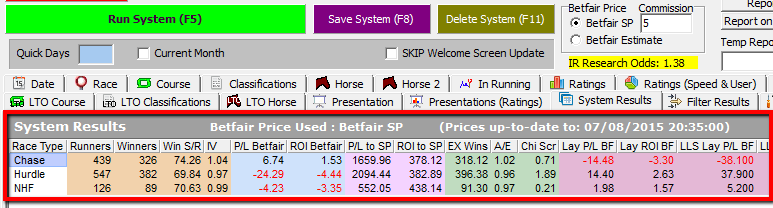
We now run the system and the following results are returned


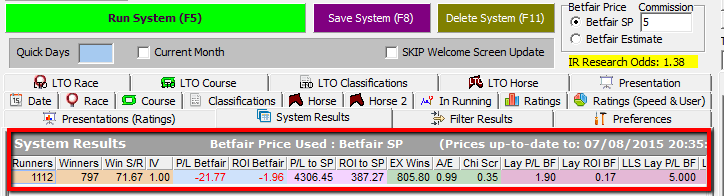
We can see that there was 1112 horses that traded 1.38 or less in running and 797 of these went on to win the race.

What follows is the returns to laying all of these 797 horses at 1.38 In Running.

The returns to laying each horse to a 1pt stake at 1.38 after 5% commission was a profit of +1.90 points, which can be seen in the Lay P/L BF column

(NOTE: When laying 1pt at 1.38 you stand to lose only 0.38 of a point if the horse wins, while if it loses you win 1pt minus commission)

The returns to laying each horse to a liability of 1pt loss at 1.38 after 5% commission was a profile of +5 points, which can be seen in the LLS Lay P/L BF column

(NOTE: When laying to a liability of 1pt, you stand to lose 1pt if the horse win, while if it loses you win 2.63pts minus commission, calculated like this 1pt / (1.38-1) )

(NOTE: The commission on the laying returns are calculated on a per market basis, since you are laying more than one horse in a race, so losing bets counteract the overall commission)

We can see from this initial query that it would be slightly profitable to lay the field in all races at Towcester, but now let’s now break down the results by race type and see if there is a particular sphere in which more or less profit is made.

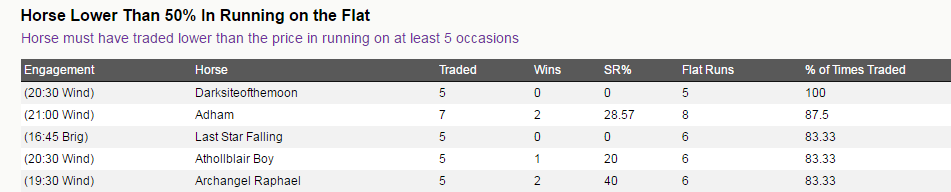
This is achieved in the system builder Presentation Tab and selecting ‘by Race Type’ and running the System again, here is the screen shot of the results:


We can see from the results that all the profit is in Hurdle races, so we now set in the Race Tab just Hurdle races, like this:


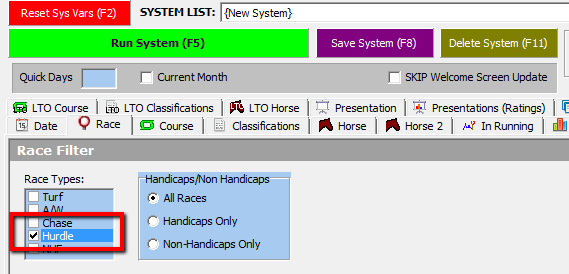
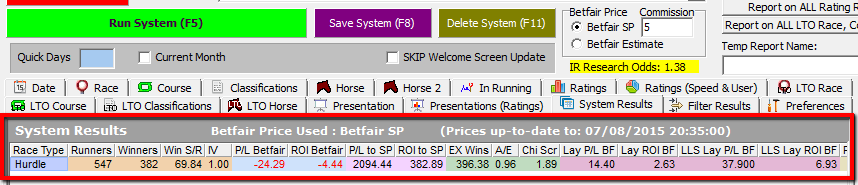
If we re-run the again, we can see a dramatic improvement in returns as shown below


However, our IR tool has a further trick up its sleeve!

Say we wanted to determine the returns at each price point between 1.38 and 1.01?


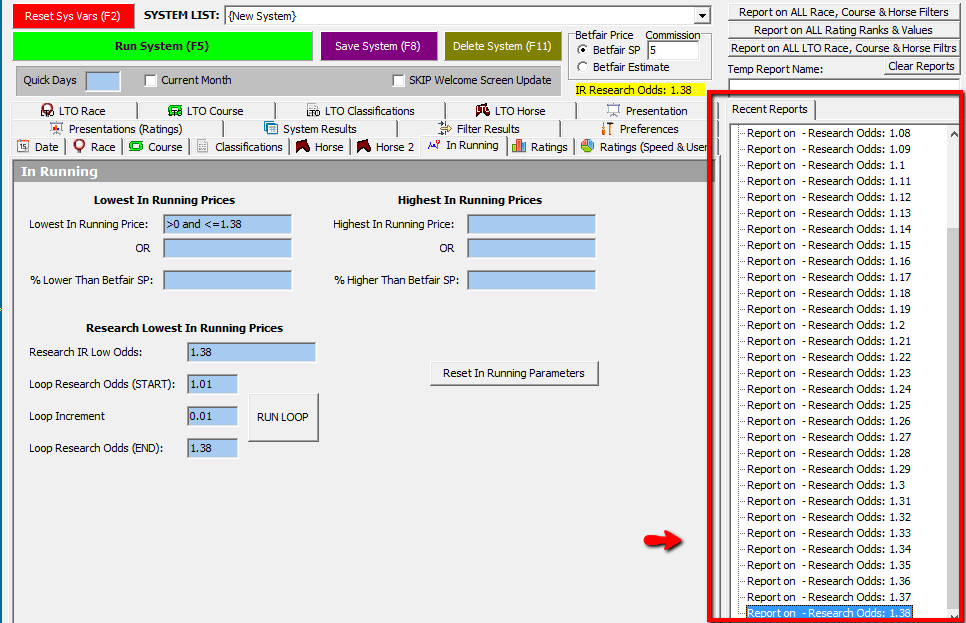
What we can do is set a loop of prices on the In Running tab so that the system will run through the Towcester NHF races and show the returns for each price point we set

In this case let’s start at 1.01 up to 1.38 with an increment of 0.01 price points each loop

Here is the screen image of the Loop set-up ready to run


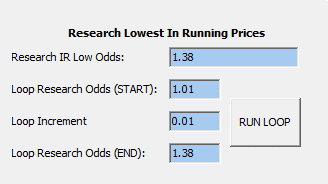
We now click the RUN LOOP button and the system builder will run 38 systems, one for each of the prices between 1.01 and 1.38 moving up in increments of 0.01 price points.

Each system will be listed in the recent reports window with the research odds used in the description, here is a screen shot after the Loop is complete.

We can now click back into each report to see the returns at each price point. Simples

The above is just one example of how the In Running Low Research Prices and the Research Loops can be used, with a little imagination and all the various parameters in Proform it is easy to see how you can find many many angles for laying the fields at In Running Low prices, for example

  • Find courses and distances where low trading horses get beat.
  • Research 1.01 prices or any other In Running Low price that get beat, by 1000's of parameters.

Using the Proform IR tools the possibilities are endless.

In Running Overview

Info:

Exchanges have revolutionised betting affording punters access to enhanced value through peer to peer connections with the dominate player betfair acting as intermediary. 

One aspect of betting on the exchanges is the increasing  popularity of in running betting which affords punters the added option of making bets while a race or match is in progress and In this video we provide an overview of the in running model in the Proform Professional Software.